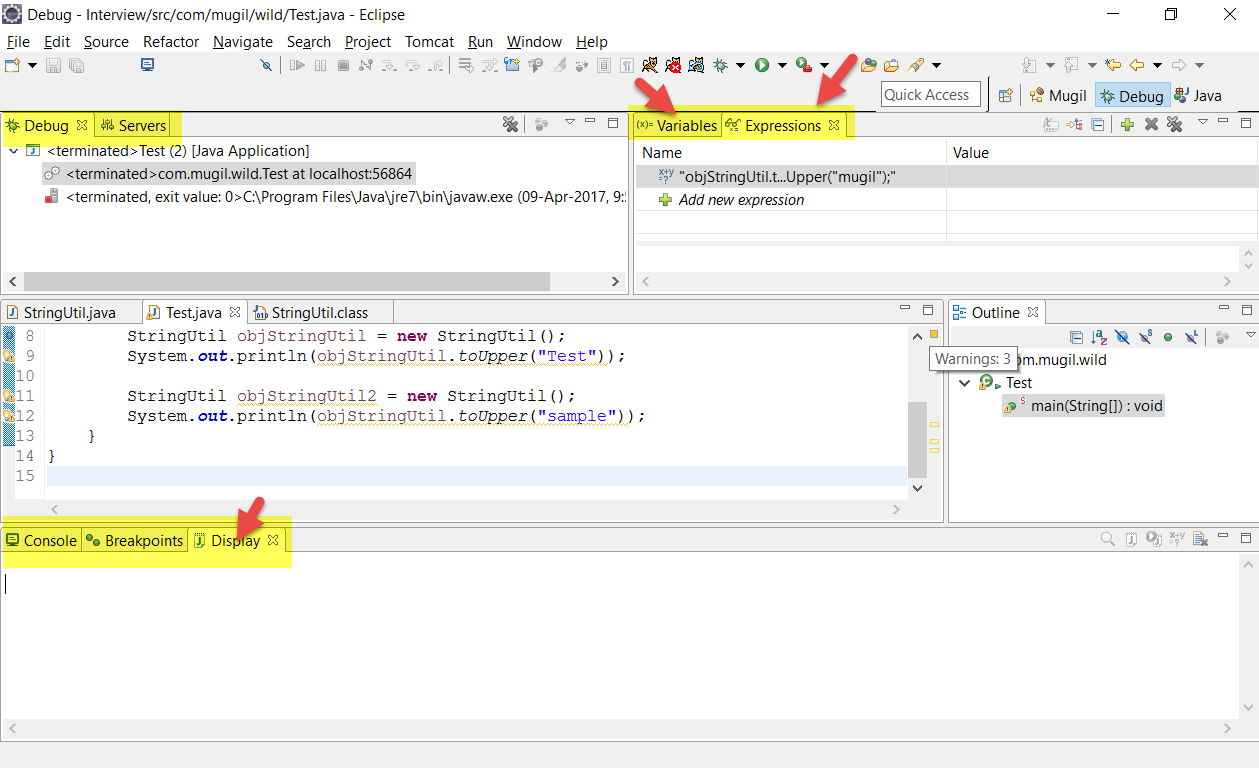
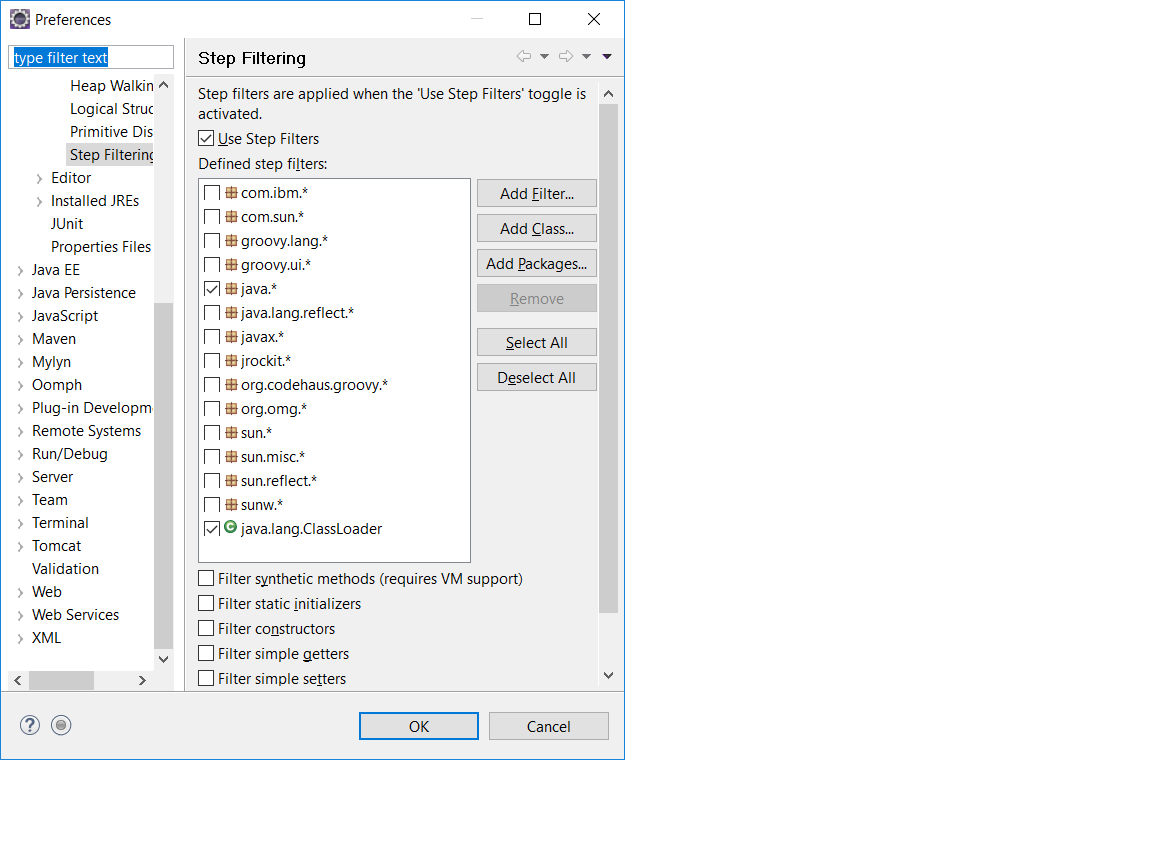
To find the Variables assigned in JSP page use Windows->Show View->Display

  • In debug perspective: Window -> Show View -> Display
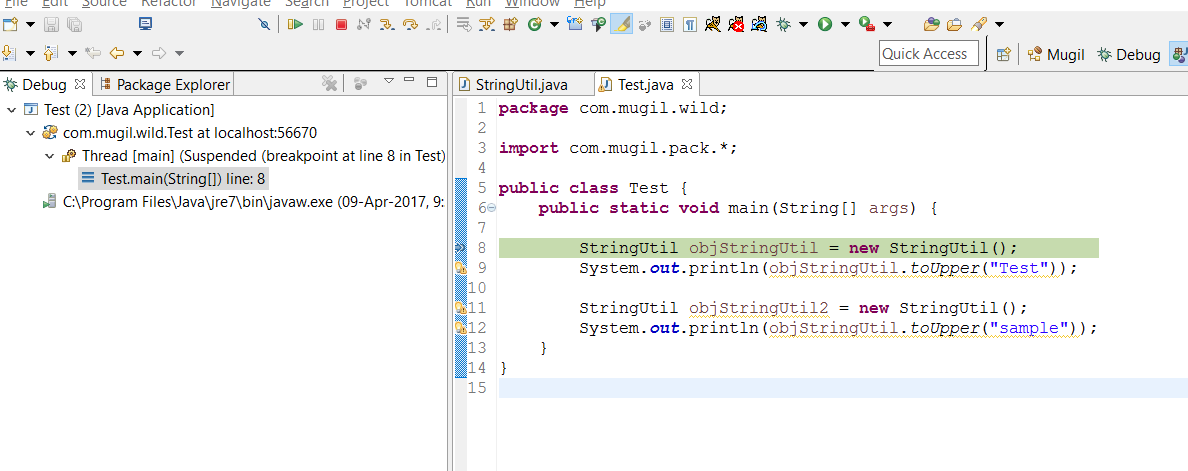
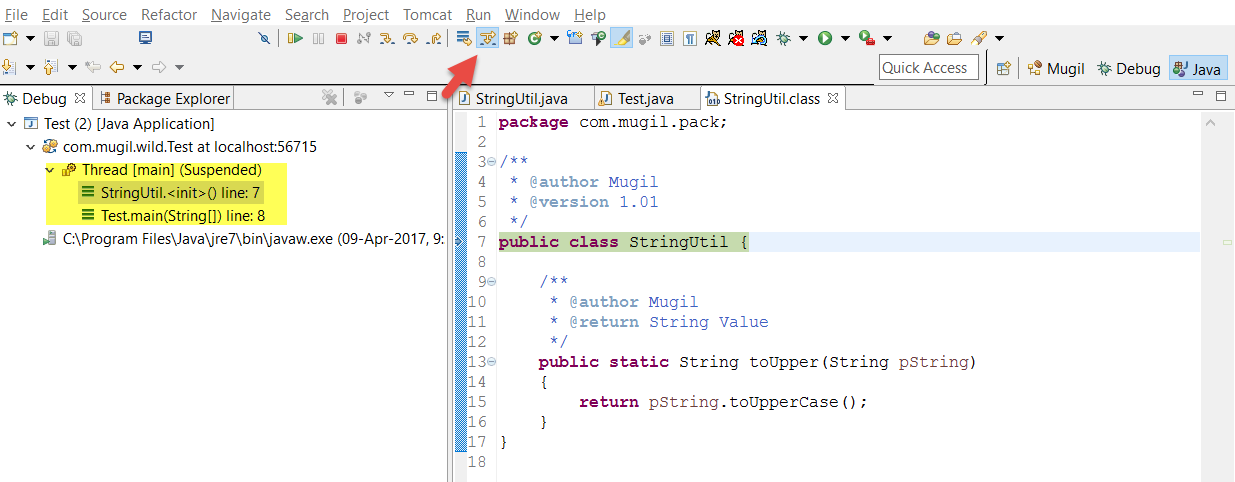
  • Put a break point in your code

Lets have a expression like one below

 <c:if test="${user.isSuccess}">
 .
 . 
 </c:if>

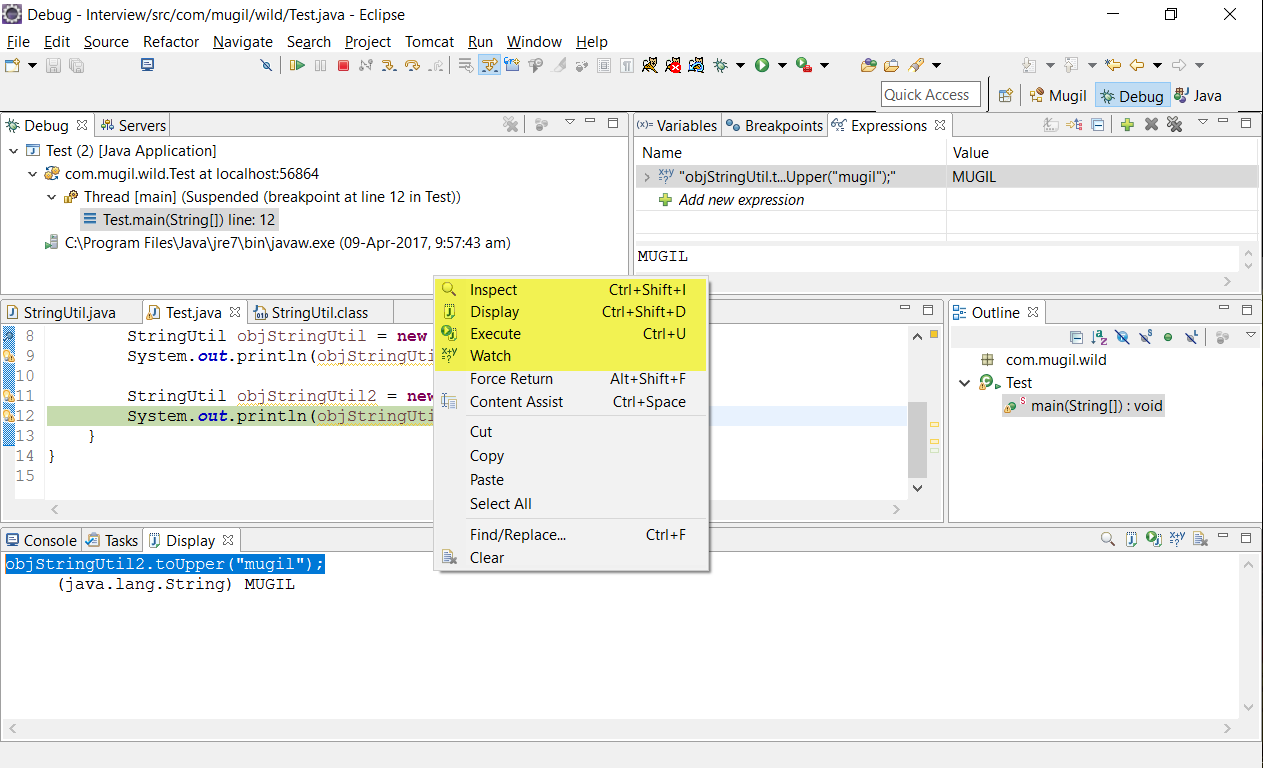
Now i need to find the value of user.isSuccess you can run the below code in in Display to see the values
set in the userObject

_jspx_page_context.findAttribute("user") 

It takes the value from the Page context and displays the values stored in the User Object

Note : The pageContext, _jspx_page_context are different variable names used for based on IDE while debugging JSP page.

Eclipse complain about @Override on interface methods?
Using the @Override annotation on methods that implement those declared by an interface is only valid from Java 6 onward. It’s an error in Java 5.
Make sure that your IDE projects are setup to use a Java 6 JRE, and that the “source compatibility” is set to 1.6 or greater. Open the Window > Preferences dialog, and browse to Java > Compiler. There you can set the “Compiler compliance level” to 1.6.

Project->Properties->java compiler->
  1. Place the Cursor in Line and press Ctrl + R while Debugging instead of using Breakpoints to get the Control over the line

Ideal Debug Perspective Setup

Options in Debug Perspective
Inspect, Display, Execute, Watch

When you added some file as JAR file and do a Debug then the Debug Stack Trace will try to go through code which doesn’t have source attached to it. In such case we can use step filtering to let debugger know files which needs to be skipped while debugging.

In the below code I try to reach for the Constructor StringUtil.But when I try to do so by pressing F5 it throws ClassNotFoundException since the class need to be loaded first time into JVM

ClassNotFoundException

Now I use Step Filer to Skip Debugger going through classes in JRE by Using StepFilter

Window -> Preferences -> Java|Debug|Step Filtering.

Now I check Java.* to make sure I skips JRE code which does class loading into JVM.

Now when I start Debug again It directly Takes me into StringUtil

We can also add other classes through which we don’t want our debugger to flow its control by Creating your own step filters as below

  1. Window > Preferences > Java > Debug > Step Filtering.
  2. Click Add Filter
  3. Enter a regular expression for the classes you want to filter in the Pattern to filter field
  4. Few custom filters as below
    • org.apache.*
    • org.hibernate.*
    • com.google.*
    • org.eclipse.*
    • org.osgi.*

      Right Click on build.xml
      Go to “Run As” >> “External Tools Configurations…”
      It shall open new window
      Go to JRE tab
      Select proper JRE if missing (sometimes jre tabs shows error mark on that.)